Once the fiscal balance was restored to a stable position in 1987, the government began to increase spending rapidly in response to the growing demand for public services. As a result, the general government 1) spending rose from 18 percent of GDP in 1987 to 30 percent in 2009 (Figure 2-15). The central government spending showed a similar growth.
Figure 2-15. General and central government spending (1953-2009)
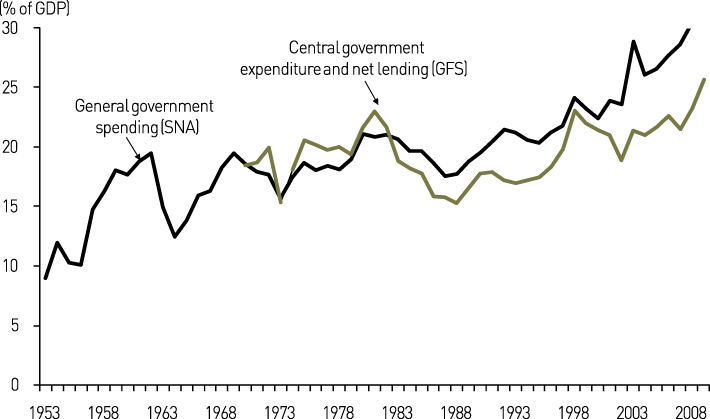
Figure 2-16. General government spending by function (1970-2008)
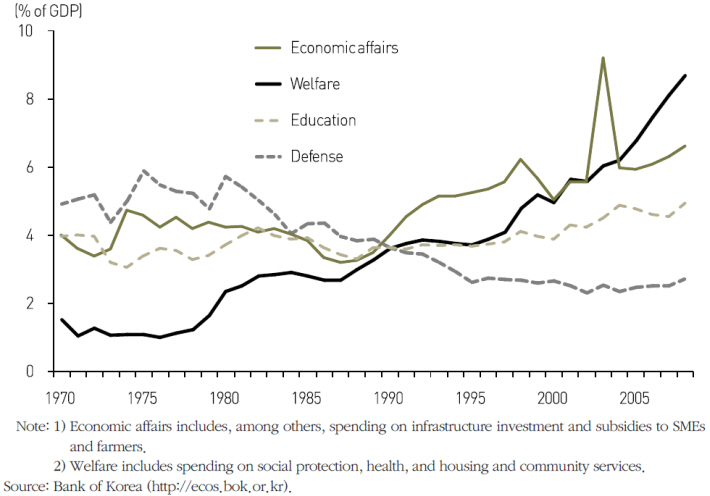
When we classify the government spending by function, its growth was particularly strong in welfare (Figure 2-16). An important factor was the National Health Insurance (NHI), which was first introduced in 1977 to firms with 500 or more employees. It subsequently was expanded in stages and came to cover the entire population in 1989, with a corresponding increase in expenditure (Table 2-12). 2)
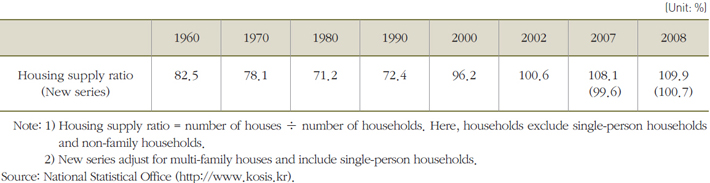
The government also sought to expand the housing supply. The housing supply ratio jumped from 72.4 to 96.2 percent within ten years between 1990 and 2000(Table 2-13).
Table 2-12. Main indicators of the National Health Insurance (1977-2008)
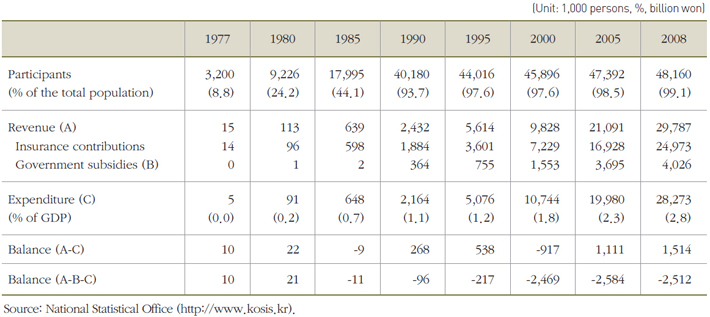
Table 2-13. Housing supply ratio (1960-2008)
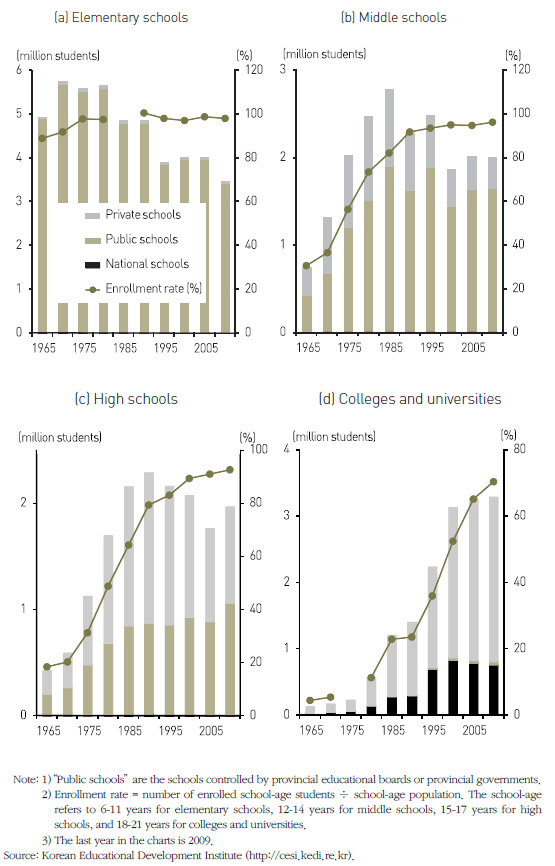
In addition to welfare spending, the spending on economic affairs grew rapidly in the early 1990s with the launch of many construction projects-roads, subways, dams and water supplies. 3) Traditionally, economic affairs and education have accounted for about Table 2-14. Expansion of transport facilities 40 percent of total government spending, with the former taking aslightly larger share than the latter. The spending on economic affairs contributed to the fast expansion of economic infrastructure (Table 2-14), while the spending on education supported the rise in enrollment rates (Figure 2-17). The enrollment rates of primary and secondary education are currently close to 100 percent, and private as well as public schools have depended heavily on the central government funding. 4)
Table 2-14. Expansion of transport facilities
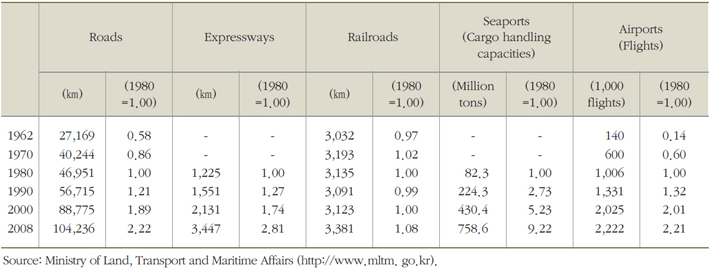
Figure 2-17. Enrollment rates and the number of enrolled students (1965-2009)
Source : SaKong, Il and Koh, Youngsun, 2010. The Korean Economy Six Decades of Growth and Development. Seoul: Korea Development Institute.
NOTE
1) General government refers to the sum of central and local governments.
2) Other social insurance programs-Industrial Accident Compensation Insurance (1964), National Pension (1988), and Employment Insurance (1995)-were introduced and expanded in a similar fashion, but their impact on total spending has been rather limited.
3) Examples include the West Coast Expressway, Seoul-Busan High-speed Railroad, and Incheon International Airport. Even though such infrastructure investment takes the lion’s share of the spending on economic affairs, it should be noted that the latter also includes subsidies to producers and other possibly unproductive spending. See Chaper 5 for further discussion on infrastructure investment.
4) Colleges and universities, on the other hand, depend mostly on tuitions for their funding. See Chapter 6 for further discussion on education policies.