Local Government and Local Finance after 1991
1. Overview
(1) Supervision of Local Finance
Although there were statutory provisions prior to this period mandating local councils’ direct involvement in decisions on matters involving local finance, those provisions were merely nominal as there were no actual local councils set up to perform such tasks. Local council elections were finally held in 1991. The installment of local councils meant that the central government’s vertical mode of supervision over local finance came to be replaced with a more horizontal model, led by local councils who could now devise and oversee local fiscal policies themselves.
[Table 4-18] Government Subsidies: 1981 to 1990
(Unit: KRW 100 million)
| Year | Government subsidies (a) | Finance | Proportion | ||
| Central (b) | Local (c) | a/b | a/c | ||
| 1981 | 6,274 | 81,744 | 29,640 | 7.7 | 21.2 |
| 1982 | 5,491 | 95,259 | 33,767 | 5.8 | 16.3 |
| 1983 | 5,708 | 107,533 | 40,148 | 5.3 | 14.2 |
| 1984 | 6,971 | 118,289 | 47,595 | 5.9 | 14.6 |
| 1985 | 7,988 | 130,089 | 49,531 | 6.1 | 16.1 |
| 1986 | 8,907 | 146,993 | 55,548 | 6.1 | 16.0 |
| 1987 | 17,619 | 178,839 | 75,717 | 9.9 | 23.3 |
| 1988 | 18,071 | 220,408 | 99,331 | 8.2 | 18.2 |
| 1989 | 27,893 | 255,909 | 144,946 | 10.9 | 19.2 |
| 1990 | 34,192 | 313,046 | 193,860 | 10.9 | 17.6 |
Source: National Statistics Office, KOSIS Fiscal Statistics, each year
Nevertheless, the central government still put considerable pressure on local governments and was still heavily involved in their fiscal policy matters. The Ministry of Home Affairs continued to develop and enforce its Basic Guidelines for Budget Preparations, and the central government continued to appoint its employees as local government accountants. In the meantime, the amendment of the Local Finance Act (LFA) in 1994 required local governments to disclose details of their fiscal operations to local residents, thus enabling residents to supervise local governments, albeit in an indirect manner.
The autonomy of local governments grew significantly under the Participatory Government, which overhauled the LFA in 2005 to transfer important fiscal tasks to local governments and enforced other measures of fiscal decentralization to enhance the fiscal autonomy and accountability of local governments. The changes ushered in by the Participatory Government in this regard include: the abolition of the Basic Guidelines on Local Budget Preparations; the abolition of the approval requirement on issuing local government bonds and the introduction of the maximum value at which such bonds may be issued; additions to the Local Fiscal Analysis System; and the introduction of the Local Fiscal Disclosure System. Article 39, newly added to the LFA, aimed at systematizing the process of the public’s participation in preparing local budgets, thereby enhancing the horizontal control of local governments by constituents themselves. Specific terms and conditions of fiscal analysis, assessment, and implementation were also added to ensure responsible spending.
A prominent reform undertaken by the Participatory Government in particular was allowing local governments to develop the basic instructions for budget preparations on their own. The preceding People’s Government had already transferred numerous budget items to local governments in 1997 and 1998 so that local governments could exercise greater autonomy on those items, and had also simplified the number and types of those items, from 11 articles to 8; 40 items to 36; and 118 sub-items to 78 in 1999 (Presidential Commission for Decentralization, 2005b; 59). Beginning in 2004, most local governments were allowed to formulate their own standards for budget and spending preparations. In 2005, the Ministry of Home Affairs’ Basic Guidelines for Local Budget Preparations was finally abolished, and the number of items subject to the standards for budget and spending preparations was also reduced.
[Table 4-19] Changes in Local Tax Revenue: 1991 to 2006
(Units: KRW 100 million, percentage)
| Year | Total revenue | Local taxes | Percentage (%) | Non-tax revenue | Percentage (%) | Local subsidies | Percentage (%) | Government subsidies | Percentage (%) |
| 1991 | 242,240 | 80,351 | 33.2 | 70,164 | 29.0 | 34,524 | 14.3 | 28,340 | 11.7 |
| 1992 | 264,285 | 94,622 | 35.8 | 76,758 | 29.0 | 32,951 | 12.5 | 22,250 | 8.4 |
| 1993 | 290,800 | 110,258 | 37.9 | 74,272 | 25.5 | 44,124 | 15.2 | 22,909 | 7.9 |
| 1994 | 372,038 | 132,278 | 35.6 | 92,681 | 24.9 | 48,600 | 13.1 | 37,865 | 10.2 |
| 1995 | 456,108 | 153,169 | 33.6 | 107,821 | 23.6 | 56,713 | 12.4 | 56,574 | 12.4 |
| 1996 | 549,651 | 173,947 | 31.6 | 160,580 | 29.2 | 65,238 | 11.9 | 65,970 | 12.0 |
| 1997 | 620,176 | 184,977 | 29.8 | 188,589 | 30.4 | 70,146 | 11.3 | 74,095 | 11.9 |
| 1998 | 627,024 | 171,483 | 27.3 | 175,462 | 28.0 | 73,313 | 11.7 | 106,266 | 16.9 |
| 1999 | 669,440 | 185,685 | 27.7 | 178,210 | 26.6 | 69,187 | 10.3 | 134,543 | 20.1 |
| 2000 | 714,314 | 203,614 | 28.5 | 176,922 | 24.8 | 84,494 | 11.8 | 131,961 | 18.5 |
| 2001 | 870,844 | 266,397 | 30.6 | 196,389 | 22.6 | 123,500 | 14.2 | 151,260 | 17.4 |
| 2002 | 1,062,689 | 315,836 | 29.7 | 234,195 | 22.0 | 124,693 | 11.7 | 244,091 | 21.1 |
| 2003 | 1,204,432 | 330,620 | 27.5 | 332,485 | 27.6 | 149,634 | 12.4 | 213,252 | 17.7 |
| 2004 | 1,190,726 | 341,594 | 28.7 | 351,502 | 29.5 | 144,296 | 12.1 | 188,322 | 15.8 |
| 2005 | 1,229,227 | 359,769 | 29.3 | 308,841 | 25.1 | 200,183 | 16.3 | 284,080* | 23.1* |
| 2006 | 1,355,771 | 412,818 | 30.4 | 301,991 | 22.3 | 217,347 | 16.0 | 342,822* | 25.3* |
Note: Figures with asterisks (*) combine the amounts of both government subsidies and municipal or provincial subsidies.
Source: National Statistics Office, KOSIS Fiscal Statistics, each year
The Ministry of Government Administration and Home Affairs (MGAHA), as it became known, began to distribute non-binding budget preparation manuals with the intention of assisting local governments in better managing actual budget tasks and fiscal policies (Presidential Commission for Decentralization, 2005b, 61). Nevertheless, certain practices by which the central government retained its control over local governments remained intact, such as its appointing central government employees to local governments as accountants, among others.
(2) Revenue Structure
Local taxes came to occupy an increasing portion of local revenue, and continued to hover above 30 percent from the 1990s onwards. The proportion of local subsidies, which had been kept relatively low throughout the 1990s in comparison to the preceding decade, suddenly spiked in 2005 when the Participatory Government came to power and significantly raised the legal local subsidy rate. In the meantime, the proportion of central government subsidies in local revenue began to increase dramatically in the late 1990s, eventually coming to outweigh local subsidies. Rising criticisms against the conformity-enforcing manner in which the central government administered such subsidies eventually led the Participatory Government to pursue major reforms in the government subsidy structure and newly create the National Balancing Special Accounting Division. The Local Grant System, first introduced in the 1990s, played a crucial role in enhancing the stability of local revenue by converting some national taxes into local ones, but eventually disappeared under the Participatory Government due to the various side effects it generated.
The proportion of local revenue to national revenue, having reached 74 percent in 1991, continued to grow at a dramatic pace and came to almost equal national revenue in the 2000s.
[Table 4-20] Comparison of National and Local Finances 1991 to 2006
| Year | National finance (A) | Local finance (B) | B/A (%) | ||
| Amount | Index | Amount | Index | ||
| 1991 | 329,287 | 100 | 242,240 | 100 | 73.6 |
| 1992 | 345,341 | 105 | 264,285 | 109 | 76.5 |
| 1993 | 385,837 | 117 | 290,800 | 120 | 75.4 |
| 1994 | 449,358 | 136 | 372,038 | 154 | 82.8 |
| 1995 | 529,280 | 161 | 456,108 | 188 | 86.2 |
| 1996 | 602,758 | 183 | 549,651 | 227 | 91.2 |
| 1997 | 659,591 | 200 | 620,176 | 256 | 94.0 |
| 1998 | 746,413 | 227 | 627,024 | 259 | 84.0 |
| 1999 | 842,801 | 256 | 669,440 | 276 | 79.4 |
| 2000 | 926,022 | 281 | 714,314 | 295 | 77.1 |
| 2001 | 1,020,084 | 310 | 870,844 | 359 | 85.4 |
| 2002 | 1,133,800 | 344 | 1,062,689 | 439 | 93.7 |
| 2003 | 1,181,323 | 359 | 1,204,432 | 497 | 102.0 |
| 2004 | 1,196,460 | 363 | 1,190,726 | 492 | 99.5 |
| 2005 | 1,364,592 | 414 | 1,229,227 | 507 | 90.0 |
| 2006 | 1,478,668 | 449 | 1,355,771 | 560 | 91.7 |
Source: National Statistics Office, KOSIS Fiscal Statistics, each year
Source: Korea Institute of Public Administration. 2008. Korean Public Administration, 1948-2008, Edited by Korea Institute of Public Administration. Pajubookcity: Bobmunsa.
2. Local Tax System
The tax system in Korea has been nation-centered since the country’s liberation from the Japanese colonial regime in the mid-1940s. Nevertheless, the importance and weight of local taxes have been growing steadily since the late 1990s as well. Whereas the ratio of national and local taxes amounted to 9:1 prior to the 1990s, the ratio shifted to 8:2 and has continued to decrease since the 1990s (KRILA, 1998, 392).
A number of noteworthy changes took place in the local tax system in the 1990s. For starters, the local development tax was introduced as a new tax earmarked to enhance revenue sources for local governments. The original margins by which local taxes were to be reduced were substantially lowered, and new earmarked provincial taxes were introduced. The individual resident tax rate, unchanged since 1979, was raised, and the race tax began to be imposed not only on horseraces, but also on cycling and motorboat races. The mileage tax was newly introduced in 1999 and the local education tax as an earmarked tax in 2000.
The amendment of the Local Tax Act (LTA) in 2005 led to the abolition of the composite land tax and the implementation of the general real estate tax (a national tax). The general real estate tax became a source of local real estate subsidies, and was distributed to local governments according to financial need. Another amendment of the LTA in 2007 allowed districts within Seoul to also levy property taxes, the resulting revenue of which was divided equally among Seoul and the districts. The revenue Seoul garnered through property taxes was then distributed again to local districts according to financial need. These reforms were undertaken to bridge the wide revenue gaps between local districts.
The framework for the current flexible tax rates came into being in 1995. Beginning in 1998, local governments were allowed to determine the additional amount of resident taxes to be paid by individuals up to KRW 10,000 by local ordinances. Flexible rates began to be applied to the public facility tax in 2001, with local governments allowed to determine and adjust up to 50 percent of each rate according to local ordinances.
Source: Korea Institute of Public Administration. 2008. Korean Public Administration, 1948-2008, Edited by Korea Institute of Public Administration. Pajubookcity: Bobmunsa.
3. Local Fiscal Adjustment System
As local subsidy taxes and central government subsidies became the primary instruments by which the central government transferred its revenue to local governments in the 1980s, higher-level local governments also came to supplement the revenue of lower-level ones by providing subsidies of their own. The dawn of the age of local government, however, compelled a major change in this basic system of revenue transfer. The Local Grant System was introduced in 1991 to ensure greater balance in local development and increased revenue for local governments. Adjustment grants also became a key part of the new local fiscal system, introduced to help adjust the fiscal balance between main local governments and district (gu) offices in Seoul and metropolitan cities (KRILA, 1998, 392-393). The Fiscal Preservation Fund also came into being in 2000 through which a portion of municipal, metropolitan, and provincial taxes collected by cities and counties were distributed to respective cities and counties according to their population, the tax amounts collected, and other financial needs. This measure significantly enhanced the authority of metropolitan and provincial local governments over their basic district counterparts.
[Table 4-21] Changes in Local Tax Items: 1990s and 2000s
| Year | Taxes in the provinces, Seoul, and metropolitan cities | Taxes in cities, counties, and districts (gu) | ||
| General | Earmarked | General | Earmarked | |
| 1991 | -Provincial taxes on property acquisition, registration, licenses, and horseraces -Seoul and metropolitan city taxes on property acquisition, registration, residents, automobiles, farmland, cattle slaughter, horseraces, and tobacco sales |
-Provincial taxes on public facilities and local development -Seoul and metropolitan city taxes on urban planning, public facilities, and local development |
-City and county taxes on residents, properties, composite land, automobiles, farmland, cattle slaughter, and tobacco sales -District taxes on licenses, properties, and composite land |
-City and county taxes on urban planning and business locations -District taxes on business locations |
| 1993 | -Provincial taxes on property acquisition, registration, licenses, and horse and other races -Seoul and metropolitan city taxes on property acquisition, registration, residents, automobiles, farmland, cattle slaughter, horse and other races, and tobacco sales |
Same as above | Same as above | Same as above |
| 1999 | -Provincial taxes on property acquisition, registration, licenses, and horse and other races -Seoul and metropolitan city taxes on property acquisition, registration, residents, automobiles, mileage, farmland, cattle slaughter, horse and other races, and tobacco |
Same as above | -City and county taxes on residents, properties, composite land, automobiles, mileage, farmland, cattle slaughter, and tobacco sales -District taxes on licenses, properties, and composite land |
Same as above |
| 2000 | -Provincial taxes on property acquisition, registration, licenses, and horse and other races -Seoul and metropolitan city taxes on property acquisition, registration, residents, automobiles, mileage, farming income, cattle slaughter, horse and other races, and tobacco sales |
-Provincial taxes on public facilities, local development, and local education -Seoul and metropolitan city taxes on urban planning, public facilities, local development, and local education |
-City and county taxes on residents, properties, composite land, automobiles, mileage, farming income, cattle slaughter, and tobacco sales -District taxes on licenses, properties, and composite land |
Same as above |
| 2001 | -Provincial taxes on property acquisition, registration, licenses, and recreational activities -Seoul and metropolitan city taxes on property acquisition, registration, residents, automobiles, mileage, farming income, cattle slaughter, recreational activities, and tobacco sales |
Same as above | Same as above | Same as above |
| 2005 | Same as above | Same as above | -City and county taxes on residents, properties, automobiles, mileage, farming income, cattle slaughter, and tobacco sales -District taxes on licenses and properties |
Same as above |
Source: LTA, amended each year
(1) Local Subsidies
The local subsidy system remained more or less intact even after the bolstering of local government that began in 1991, with the local subsidy rate still fixed at 13.27 percent of combined domestic taxes. However, in 1999 the People’s Government under President Kim Daejung raised this figure to 15 percent and also changed the mode in which local subsidies were administered and distributed to ensure less dependence on the Ministry of Home Affairs and more reliance on the provisions and principles of the amended Local Subsidy Act (LSA) of 1997. New statutory provisions were also enacted to ensure increased local subsidies for supporting local development and economic revitalization.
The Participatory Government further raised the local subsidy rate of combined domestic taxes to 18.3 percent (not counting earmarked taxes, however). Such an increase was necessary to expand local subsidy sources and revenue for local governments carrying out road maintenance and other types of public works that were previously supported by local grants.
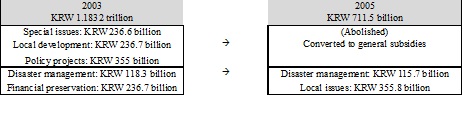
Furthermore, the proportion of earmarked subsidies in local subsidies was lowered from one-eleventh to four-hundredths (Article 4, LSA of 2004) in response to criticisms over such earmarked subsidies being distributed in an arbitrary and less than legitimate manner in amounts that had exceeded KRW 1 trillion from 2001 onward. The Participatory Government thus sought to downsize both the amount and the range of earmarked subsidies. Whereas earmarked subsidies were formerly directed at five main types of demands (i.e., policy projects, financial preservation, disaster management, local development, and specific issues), the new earmarked subsidies were now provided for only two types of demands (i.e., specific local issues and disaster management) according to Article 9 of the LSA. “Specific local issues” encompassed specific issues/projects and matters of financial preservation that required subsidization. Specific projects included those pertaining to urban development, social welfare, and culture and the arts. Projects of financial preservation concerned national events, administrative re-districting, and fiscal deficits. More thoroughgoing preliminary reviews were held in advance of these local issues and projects, and the amounts of subsidies provided were reduced in case the relevant local governments failed to achieve given targets or adequate budget control through their own fault (Presidential Commission for Decentralization, 2005b, 49-51).
Earmarked subsidies were also provided for the purposes of disaster management, i.e. for emergency restoration, port reconstruction, and others. Earmarked subsidies were used to handle part of the cost that affected local governments were required to bear with respect to emergency rescue measures and port reconstruction. More specifically, subsidies for emergency measures were provided as needed, while those for port reconstruction were granted according to given schedules (Presidential Commission for Decentralization, 2005b, 51).
[Table 4-22] Changes in the Local Subsidy System: 1997 and 1999
| Local Subsidy System, 1997 | Local Subsidy System, 1999 | |
| Sources of revenue | 13.27% of domestic taxes combined (except for those allotted to local grants). However, additional amounts were appropriated when unforeseen demands arose. | 15% of domestic taxes combined (except for those allotted to local grants). However, additional amounts were appropriated when unforeseen demands arose. |
| General subsidies | 10/11 of total subsidies | Same as 1997 |
| Earmarked subsidies | 1/11 of total subsidies | Same as 1997 |
| Method of distributing general subsidies | To be distributed in cases where the reference financial revenue fell short of the reference financial demand | Same as 1997, except that no subsidies were reserved for districts (gu) |
| Method of distributing earmarked subsidies | Policy projects: 30% Financial preservation: 20% Disaster management: 10% Local development: 20% Special issues: 20% -To be provided either upon request from local governments or by the directive of the Ministry of Home Affairs |
Same as 1996 |
Sources: LSA, amended each year; Enforcement Ordinance for the LSA, amended each year
Source: Presidential Commission for Decentralization, 2007, 165
[Figure 4-1] Reform of the Earmarked Subsidy System
Moreover, the central government sought to use earmarked subsidies as incentives to enhance the fiscal performance of local governments, providing the surplus balance of subsidies reserved for disaster management to local governments with exemplary administrative and fiscal policy records (Article 9, LSA of 2004). The amended LSA of 2004 abolished the obligation to receive pre-approval for any increase in local subsidies, as it left room for the arbitrary execution and distribution of subsidies. Such moves were intended to enhance the fairness and impartiality of local subsidies and their execution.
The government subsidy system was also reformed, with some government subsidy projects transferred to local governments. The new “decentralization subsidy tax” was introduced to support this transfer of government subsidies (Article 3, LSA, amended as of December 30, 2004). Of the government subsidy projects transferred to local governments since 2005, 149 projects, except for 16 under the supervision of the Ministry of Education (for a total value of KRW 100 billion), were subjected to the MGAHA and the decentralization subsidy tax. The means for these subsidies were derived from 0.83 percent of domestic taxes combined (KRW 846.6 billion of the 2005 budget) and part of the increase on local taxes (KRW 111.5 billion) resulting from the rise in the tobacco sales tax. The proportion of the decentralization subsidy tax to domestic taxes combined was increased to 0.94 percent, or KRW 1.24 billion, in 2006 (Presidential Commission for Decentralization, 2007, 172).
The decentralization subsidy tax was to be imposed for five years only, between 2005 and 2009, and afterward subsumed under general subsidy taxes (beginning in 2010). The financial resources for subsidies were to be divided mainly between ordinary and extraordinary needs. The formula for allocating these resources was determined on the basis of the level of subsidies provided to local governments in the preceding five years as well as on statistics on transferred projects (Presidential Commission for Decentralization, 2005b, 52).
In 2005, the central government decided to provide the entire amount of the general real estate tax, newly created as a result of real estate tax system reform, as local subsidies so as to preserve some of the losses to local revenue resulting from the abolition of the local composite land tax. Real estate subsidies were allocated to local governments according to their financial and other needs with a view to ensuring at least a degree of financial stability in poorer local governments (Articles 4 and 9.3, LSA of 2005).
[Table 4-23] Changes in the Local Subsidy System: 2004 and 2005
| LSA January 29, 2004 |
LSA December 30, 2004 |
LSA 2005 |
|
| Sources of revenue | 18.3% of domestic taxes combined (except earmarked taxes) | 19.13% of domestic taxes combined (except earmarked taxes) | 19.24% of domestic taxes combined (except earmarked and general real estate taxes) |
| General subsidies | 96/100 of total subsidies | 96/100 of total subsidies (except decentralization subsidy taxes) | 96/100 of total subsidies (except decentralization and real estate subsidy taxes) |
| Earmarked subsidies | 4/100 of total subsidies | 4/100 of total subsidies (except decentralization subsidy taxes) | 4/100 of total subsidies (except decentralization and real estate subsidy taxes) |
| Method of distributing general subsidies | In cases where the reference financial revenue fell short of the reference financial demand | Same as 2004 | Same as 2004 |
| Method of distributing earmarked subsidies | Local issues: 50% Disaster management: 50% -To be distributed either upon request from local governments or by the directive of the Ministry of Home Affairs -Surplus balance to be distributed to local governments with exemplary fiscal records |
Same as January 2004 | Same as January 2004 |
| Decentralization subsidies | None | Provided for government subsidy projects transferred -0.83% of domestic taxes combined |
Same as December 2004 -However, now the figure was raised to 0.94% of domestic taxes combined |
| Real estate subsidies | None | None | General real estate tax now distributed to local governments |
Sources: LSA, amended each year; Enforcement Ordinance for the LSA, amended each year
Source: Korea Institute of Public Administration. 2008. Korean Public Administration, 1948-2008, Edited by Korea Institute of Public Administration. Pajubookcity: Bobmunsa.
(2) Local Grants
Pursuant to Paragraph (1), Article 5, of the Act on the Adjustment of National and Local Taxes as well as Paragraph (2), Article 3, of the Special Tax Management and Accounting Act for Rural Communities (amended as of 1994), funding for local grants was to be derived from the following sources: (1) the entire amount of telephone taxes or other such equivalent local taxes collected and from those pertaining to local development; (2) 50 percent of the excessive landholding tax as a way of returning the profits of local development generated in relation to local projects for which local grants were provided; (3) the entire amount of liquor taxes or other such equivalent local taxes collected (the grant ratio of liquor taxes was gradually raised from 15 percent in 1991, to 60 percent in 1992, 80 percent in 1994, and 100 percent in 1997); and (4) 19/150 of special rural community taxes collected according to the Rural Community Development Measures with the goal of preserving losses to local government funds.
The distribution ratio of local grants for different types of projects was revisited multiple times. All in all, the largest amount of local grants went to road maintenance, followed by water pollution initiatives. The Enforcement Ordinance for the Local Grants Act also specified the criteria according to which local grants were to be divided among eligible projects so as to ensure fairness and impartiality in local grant distribution.
The local grant system yielded significant results throughout the 12 years of its implementation, especially in terms of enhancing the stability of local finance and encouraging local development projects. Whereas the local budget grew by 4.6 times on average between 1991 and 2003, the revenue for local grants grew by 8.8 times over the same period. The proportion of local grants to local finance similarly grew from 3.3 percent to 6.3 percent. In particular, the ratio of paved roads grew from 32.2 percent in 1991 to 46.3 percent in 2002, amounting to some additional 62,272 kilometers of paved roads nationwide, as local grants centrally assisted local road maintenance projects. Thanks to local grants, 562 out of 768 myeon-type rural communities (73.2 percent) also saw great improvements in their living conditions. Local grants allotted to water pollution prevention projects mainly went towards setting up new facilities for processing sewage and dairy farming waste, as well as for purifying polluted rivers and streams, and maintaining sewage pipes. Local grants were also provided for local development projects for river restoration, youth education, and the like (Presidential Commission for Decentralization, 2005b, 54-55).
Nevertheless, local grants also brought to the fore multiple problems, especially with respect to earmarked taxes being their source and special government accounting. Although the original list of local grant sources did not include any earmarked taxes, the requirement that 100 percent of the liquor tax, 14.2 percent of the transportation tax, and 15.3 percent of the special rural community tax be used to fund those grants appeared to allow for the appropriation of earmarked taxes in general. Earmarked taxes were especially helpful when their purposes and spending were strongly correspondent. These correspondences helped to minimize objections to taxation and facilitated the efficient allocation of the resulting revenue. The lack thereof, however, increased the rigidity of the spending structure. The investment of a certain portion of earmarked taxes as grants for road improvement led local governments to undertake road maintenance projects without discrimination or careful cost-benefit analysis. The hair-splitting criteria for distributing local grants to metropolitan, local, municipal, county, rural, and other such types of roads also compromised the efficiency of spending. Projects for preventing water pollution were more or less supported by government subsidies provided via the Ministry of Environment. Youth education projects did not particularly require local grants, either (Presidential Commission for Decentralization, 2007, 167).
[Table 4-24] Distribution of Local Grants by Project Type: 1990s and 2000s
| Project type | Road maintenance | Rural development | Water pollution prevention | Youth education | Local development |
| 1991 | 70.5% of grant budget | 11.5% of grant budget | 17% of grant budget | 1% of grant budget | None |
| 1993 | 70.5% of grant budget (except liquor tax-based grant budget) | 11.5% of grant budget (except liquor tax-based grant budget) | 17% of grant budget (except liquor tax-based grant budget) | 1% of grant budget (except liquor tax-based grant budget) | 20% of liquor tax |
| 1994 | 70.5% of grant budget (except liquor tax- and special rural tax-based grant budget) + 60% of special rural tax | 11.5% of grant budget (except liquor tax- and special rural tax-based grant budget) | 17% of grant budget (except liquor tax- and special rural tax-based grant budget) + 40% of special rural tax | 1% of grant budget (except liquor tax- and special rural tax-based grant budget) | 20% of liquor tax |
| 1996 | 40% of liquor tax, 63% of grant budget except special rural tax, and 60% of special rural tax | 40% of liquor tax, and 11.5% of grant budget except special rural tax | 40% of liquor tax, 24.5% of grant budget except special rural tax, another 10% of liquor tax, and 40% of special rural tax | 40% of liquor tax, and 1% of grant budget except special rural tax | 30% of liquor tax |
| 2000 | 100% of transportation tax-based grant budget, 14.7% of liquor tax-based grant budget, and 60% of special rural tax | 14.1% of liquor tax-based grant budget | 40% of liquor tax-based grant budget and 40% of special rural tax | 1.2% of liquor tax-based grant budget | 30% of liquor tax-based grant budget |
| 2001 | 100% of transportation tax-based grant budget, 8.1% of liquor tax-based grant budget, and 50% of special rural tax | 14.1% of liquor tax-based grant budget | 40.6% of liquor tax-based grant budget and 50% of special rural tax | 1.2% of liquor tax-based grant budget | 30% of liquor tax-based grant budget |
Source: Local Grants Act, amended each year
[Table 4-25] Local Grants in Local Budgets: 1997
| Project type | Project unit | Proportions of local budgets |
| Road maintenance |
|
|
| Rural development |
|
|
| Water pollution prevention |
|
|
| Youth education |
|
Facilities: 50% metropolitan budget, 44% others Operations: 50% city/county/district (gu) budget |
| Local development |
|
River stream restoration: 50% city/county/district (gu) budget |
Source: KRILA, 1998, 444
Given the purpose of local grants, local governments should not have had to pay for any of these local projects. In reality, however, local governments bore certain financial burdens for these projects. The sizes of those burdens differed by jurisdiction size and the nature of the projects concerned
The local grant system was stopped in 2003 to enhance the autonomy of local governments and the efficiency of local finance. The budget for local grants was merged with that for local and government subsidies. Accordingly, KRW 2.6696 trillion of the local grant budget set aside in 2004 (including KRW 1.9134 trillion for road maintenance and KRW 756.2 billion for local development) was incorporated into the budget for local subsidies. Another KRW 1.3722 trillion (including KRW 1.3419 trillion for water pollution prevention and KRW 30.3 billion for youth education) went into government subsidies. The remaining KRW 355.4 billion (for rural community development) went towards funding the newly created Special Account for Balanced Regional Growth. New statutory provisions were enacted to ensure that the local subsidy budget would be used to pay for the cost of completing local road maintenance projects that were already underway at this point, including the expenses associated with non-subsidy-paying government organizations (amounting to KRW 850 billion a year, between 2005 and 2008; see the Supplementary Provisions for the Local Subsidy Act of 2004) (Presidential Commission for Decentralization, 2007, 168).
Source: Korea Institute of Public Administration. 2008. Korean Public Administration, 1948-2008, Edited by Korea Institute of Public Administration. Pajubookcity: Bobmunsa.
(3) Government Subsidies
The government subsidy system experienced much transformation in the early 1990s due to the promulgation of a new law, at the end of 1986, on the budgeting and management of government subsidies. The new law first required that local government requests and applications for subsidies be incorporated into the process subsidy budget preparations. It also defined the scope of projects eligible for government subsidies, as well as the standard subsidy rate for each type of eligible project, so that local governments could plan ahead to ensure projects were subsidized in a systematic and organized manner. Moreover, the new law enacted a differential subsidy rate system so that the amounts of subsidies to be provided could be adjusted depending on the financial conditions of given local governments and also in the interest of more balanced regional growth.
In 1991, road maintenance projects, until then subsidized by the central government, became subject to local grants. While the amounts of local subsidies and grants provided steadily increased from year to year, the amounts of government subsidies fluctuated widely, and ended up compromising local governments’ abilities to plan ahead. Government subsidies were also provided according to the priorities of central, not local, governments. The wastes associated with post-project reimbursements and the tendency to promote low-priority projects solely for the purpose of appropriating the National Treasury as planned all became subjects of increasing criticisms (KRILA, 1998, 438).
The arrival of the Participatory Government in 2003 saw an epochal change in the government subsidy system. The repeated meetings among the related ministries, departments, and taskforces from August 2003 to February 2004 culminated into the division of government-subsidized projects into three types: those to be transferred to local jurisdictions; those to be placed in the newly created Special Account for Balanced Regional Growth; and those to be kept intact on the government subsidy payroll. The criteria used to re-sort these government-subsidized projects can be summarized as below (Presidential Commission for Decentralization, 2007, 161-162).
First, the projects to be transferred to local authorities were: (1) government-subsidized projects involving the maintenance of municipal and provincial water facilities, local cultural properties, locally specialized themes, and other clear local affiliations or associations; (2) programs for providing operating expenses for public facilities, such as local continuing education centers, athletic facilities for people with disabilities, centers for rural women, etc.; (3) projects for offsetting losses to local revenue, such as the secondary preservation of public funds, etc.; (4) projects requiring only small amounts of support from the National Treasury, and generating little return, such as those pertaining to the hygiene of fishery products, the setting up of eco-friendly public lavatories, etc.
Second, the projects to be included in the Special Account for Balanced Regional Growth included: (1) projects of developing local social overhead capital, including the development of remote areas, farming villages, mountainous villages, fishing villages, etc.; (2) projects promoting local culture, art, and tourism, such as the development of public libraries, local community centers, tourist belts, etc.; (3) strategic projects promoting local industries, cultural and industrial infrastructure, science and technology, etc.; and (4) projects involving the development and management of agricultural-industrial clusters, development-restricted zones, etc.
Third, the projects to continue to receive government subsidies were: (1) tasks clearly national in nature, such as passport issuance, national security management system maintenance, etc.; (2) projects of vital importance to the nation that are not likely to be tended to if transferred to the local level, such as environmental, forestry, and healthcare projects and ancillary works; and (3) projects with major implications for the central government’s policies, such as those supporting agricultural restructuring, basic living security, educational curricula, etc.
The transfer of budgets for government-subsidized projects began with the budget of 2005. Approximately KRW 1.1 trillion for 161 projects was transferred to local authorities and KRW 3.6 trillion for 126 projects to the Special Account for Balanced Regional Growth, while KRW 7.9 trillion of the government subsidy budget for the remaining 233 projects remained intact (Presidential Commission for Decentralization, 2005b, 38).
[Table 4-26] Changes in Government Subsidies: 1990s~2000s
(Unit: KRW 1 trillion)
| Year | 1991 | 1995 | 1997 | 1999 | 2001 | 2003 |
| Government subsidies (A) | 2.0 | 3.9 | 5.9 | 8.6 | 10.6 | 12.1 |
| Previous budget (B) | 13.1 | 22.4 | 30.6 | 31.6 | 46.1 | 53.2 |
| A/B (%) | 15.3 | 17.4 | 19.3 | 27.2 | 23.0 | 22.7 |
Source: Presidential Commission for Decentralization, 2005b, 36
(4) Special Account for Balanced Regional Growth
The Special Account for Balanced Regional Growth first made its appearance under the Participatory Government, mainly in response to criticisms over the arbitrary manner in which central government funds were being provided for individually screened projects. By providing fixed amounts of funds in the form of all-purpose subsidies, the Special Account sought to encourage local governments to develop and enhance their ability to plan and organize, autonomously and creatively, the projects they needed. In other words, the core mission of the Special Account was to convert a major portion of government subsidies into all-purpose subsidies for local governments to appropriate as they saw fit (Presidential Commission for Decentralization, 2007, 163).
The following project types were eligible for Special Account funds: (1) projects promoting the development of social overhead capital in remote, rural, and/or mountainous regions and areas, such as islands, farming villages, mountainous villages, fishing villages, etc.; (2) projects promoting the development of local cultural, artistic, and tourist resources, such as public libraries, local community centers, tourism belts, etc.; (3) strategic projects promoting the development of local industries, cultural and industrial infrastructure, scientific and technological innovation, and culture and/or tourism clusters; (4) projects for developing agricultural-industrial clusters, development-restricted zones, and other such projects listed in the Special Act for Balanced National Growth (Presidential Commission for Decentralization, 2005b, 43).
The review and consolidation of 533 government-subsidized projects, amounting to KRW 12.7 trillion in total, in 2004 led to the transfer of 126 of those projects (totaling KRW 3.6 trillion) to the Special Account. In particular, the majority of projects administered by the ministries of culture & tourism, agriculture & forestry, industry & energy, health & education, and maritime affairs & fishery were placed under the Special Account. The Special Account drew mainly on diverse special accounts for funds, including liquor tax revenue, and on special accounts for rural restructuring, special rural tax management, environmental improvement, transportation facility construction, land management and balanced regional growth initiatives, local grant management, and the like (Presidential Commission for Decentralization, 2005b, 43-44).
The fact that the Special Account provided all-purpose government subsidies for a wide range of projects handled by different ministries and departments allowed these organizations to prioritize different projects with greater accuracy. The process in which local governments applied for these subsidies, however, was more complicated than the one prior to the introduction of the Special Account (Presidential Commission for Decentralization, 2007, 163-164). In order for local governments to genuinely benefit from the Special Account, they needed to take proactive and autonomous steps to discover and develop projects that could actually benefit local economies, and also had to ensure thoroughgoing planning, execution, and follow-up management of projects that had been launched. Once the autonomous and performance-oriented structure of the Special Account subsidies became the norm, local spending grew more autonomous and accountable.
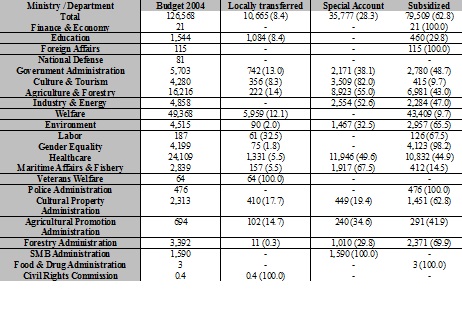
[Table 4-27] Changes in Government-Subsidized Projects by Ministry/Department: 2004
(Units: KRW 100 million, percentage)
Source: Presidential Commission for Decentralization, 2005b, 39
(5) Local Government Bonds
Local governments traditionally had to obtain the central government’s permission before issuing any local government bonds. This mechanism enabled the central government to maintain tight control over the issuers, purposes, and projects of local government bonds. This pre-approval system retained much of its basic structure, but meaningful changes were made to its terms and conditions. A notable institutional change occurred when the central government began to allow local governments in 1997 to take out commercial loans. Thanks to this policy change, certain local governments were able to borrow from institutions in Japan, the United States, and elsewhere around the world (KRILA, 1998, 393).
The Participatory Government heeded criticisms about the excessive control the central government and local councils exercised over local governments in matters of bond issuance, control which tended to reinforce the inefficiency and unwieldiness of local finance. The Participatory Government thus instituted a serious amendment to the Local Finance Act in 2005, significantly simplifying the procedures for issuing local government bonds. Under the amended legislation, the central government merely proposed formulae to assist local governments in determining the maximum amounts of bonds to be issued by government type and year. Local governments could refer to these formulae as non-binding guidelines and consult local councils to determine the amount of bonds they were to issue (Article 11). Bonds for projects geared at recovery in the aftermaths of natural disasters or other national policy matters were exempt from this requirement of mandatory ceilings. Projects involving foreign currency debts and exceeding government-proposed guidelines were required to receive approval from the Ministry of Government Administration. Local governments were also now allowed to issue additional bonds to compensate for debt amounts repaid during each given year.
Source: Korea Institute of Public Administration. 2008. Korean Public Administration, 1948-2008, Edited by Korea Institute of Public Administration. Pajubookcity: Bobmunsa.