industry technology
Components of growth
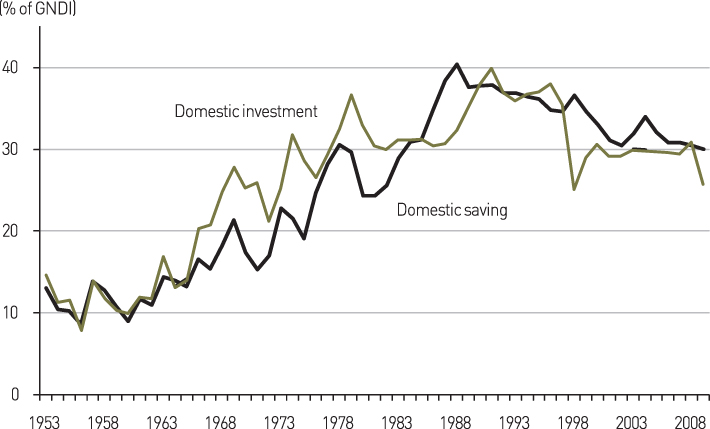
The rapid economic growth and structural transformation was the result in the first place of the rapid accumulation of productive capital. From the mid-1970s to the present, the investment rate has stayed at 30-40 percent, reaching a peak in 1991 at 40 percent (Figure 3-7). Domestic investment has been mostly financed by domestic savings except between the mid-1960s and mid-1980s when Korea ran a large current account deficit.
Figure 3-7. Investment and savings rates
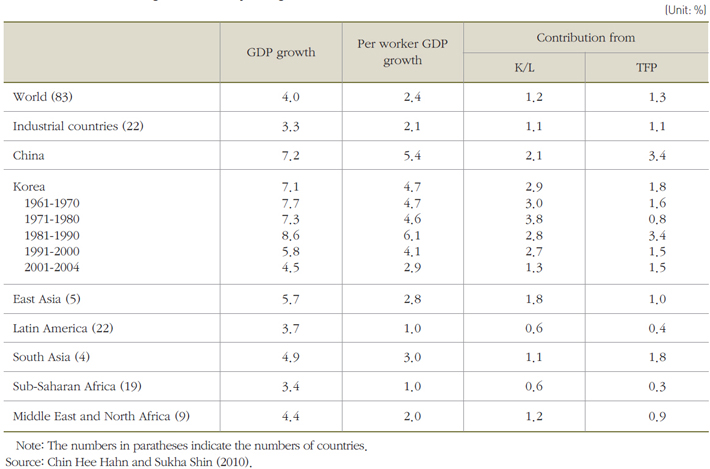
In fact, Krugman (1994) contended that most of East Asia’s economic growth stemmed from factor accumulation rather than efficiency improvement and would soon face deceleration as the diminishing returns set in. He bases his argument on a series of growth accounting analyses by Young (1992, 1993, 1995), which point out the small contributions of total factor productivity (TFP) to the growth of East Asian economies. A recent study by Chin Hee Hahn and Sukha Shin (2010) gives a similar result (Table 3-5). Between 1961 and 2004, per worker GDP grew by 4.7 percent annually, out of which 1.8 percent came from the TFP growth and 2.9 percent from per worker capital accumulation. The figures for industrial countries were 2.1 and 1.1 percent, respectively. Therefore the TFP growth explains 38 percent of the per worker GDP growth in Korea and 52 percent in industrial countries.
Table 3-5. Sources of growth in major regions (1961-2004)
Jong-il Kim (2002) proposes an interesting hypothesis on the reason for the smaller role played by TFP in East Asia. According to him, technological progress is often heavily biased in a physical capital-using direction in the early stage of modern economic growth. Once the first phase of industrialization comes to a close, however, the technological progress becomes less capital-using and the bias shifts in an intangible capital-using direction, yielding a higher estimate of the TFP growth. In this respect, it is very important for Korea and other East Asian countries to invest in intangible capital such as education and R&D to make a successful transition from a low-TFP to a high-TFP economy.
Still, according to the above table, Korea’s absolute level of TFP growth in the past has been quite remarkable, higher than that of industrial countries and surpassed only by China’s. Where did such efficiency improvement come from? Three of its main sources are technological progress, resource reallocation and international trade. Each of these sources is discussed in some detail in the rest of this subsection.
Source : SaKong, Il and Koh, Youngsun, 2010. The Korean Economy Six Decades of Growth and Development. Seoul: Korea Development Institute.
References
· Krugman, Paul“, The Myth of Asia’s Miracle,”Foreign Affairs, Vol. 73, No. 6, 1994, pp.62-78.
· Young, Alwin“, A Tale of Two Cities: Factor Accumulation and Technical Change in Hong Kong and Singapore,”in Olivier J. Blanchard and Stanley Fisher (eds.), NBER Macroeconomics Annual 1992, 1992, pp.13-54.
· Young, Alwin “ Lesson from the East Asian NICs: A Contrarian View,”NBER Working Paper, No. 4482, 1993
· Young, Alwin “The Tyranny of Numbers: Confronting the Statistical Realities of East Asian Growth Experience,”Quarterly Journal of Economics, Vol. 110, No. 3, 1995, pp.641-680.
· Hahn, Chin Hee and Sukha Shin,“ Understanding the Post-crisis Growth of the Korean Economy: Growth Accounting and Cross-country Regressions,”in Takatoshi Ito and Chin Hee Hahn (eds.), The Rise of Asia and Structural Changes in Korea and Asia, Edward Elgar, 2010, pp.97-141.
· Jong-il Kim “Total Factor Productivity Growth in East Asia: Implications for the Future,”Asian Economic Papers, Vol. 1, No. 2, 2002, pp.50-74.