industry technology
Rapid changes in industrial structure
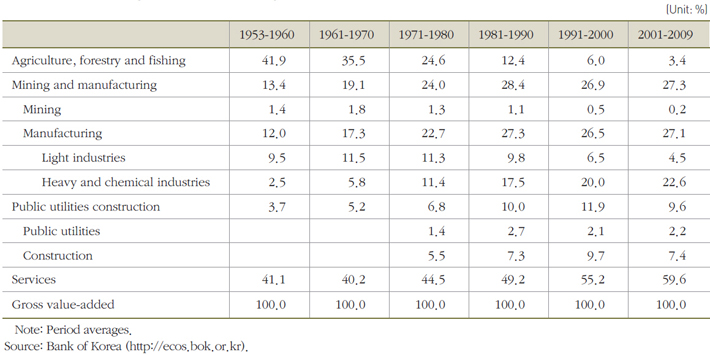
After a long period of stagnation, the Korean economy began to grow rapidly in the 1960s. The growth spurt was led by manufacturing, whose output grew annually by 17 percent in the 1960s and 16 percent in the 1970s (Table 3-1). The share of manufacturing in gross value-added rose from 12 percent in 1953-1960 to 23 percent in 1971-1980 (Figure 3-1, Table 3-2). Its share in total employment also rose rapidly (Figure 3-2). In the meantime, the share of services increased continuously in terms of both value-added and employment, whereas that of agriculture declined. Within manufacturing, heavy and chemical industries (HCIs) have increased their share at the expense of light industries (Figure 3-3, Table 3-2)
Table 3-1. Annual output growth by sector
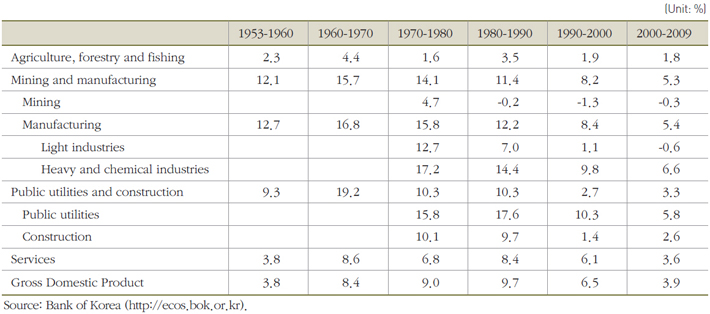
Figure 3-1. Share in gross value-added by sector
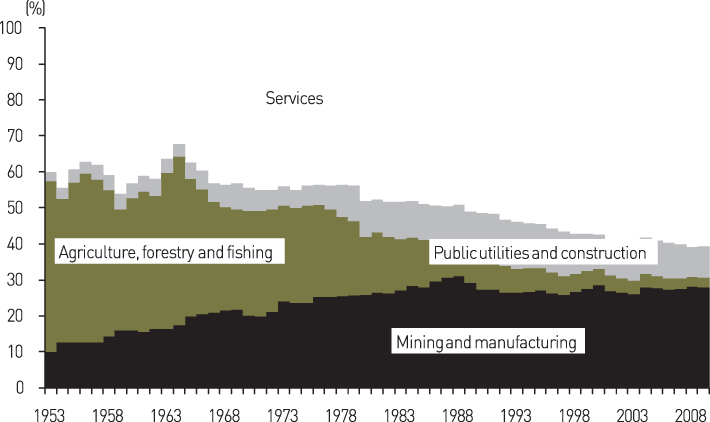
Table 3-2. Share in gross value-added by sector
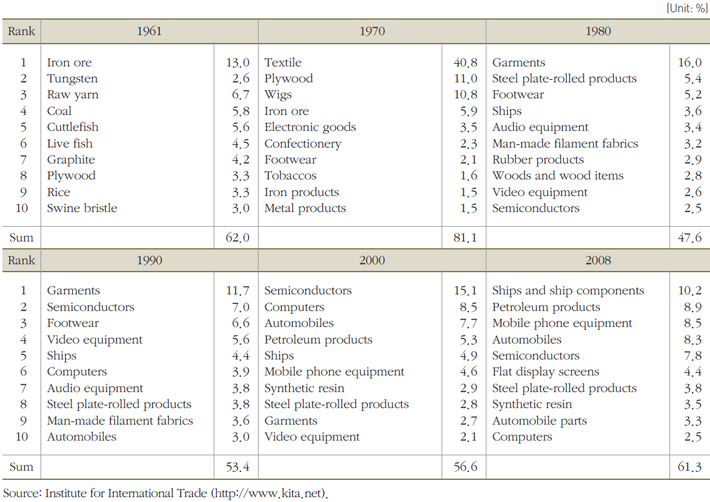
Similar changes have occurred in the export structure (Figure 3-4). In 1970, the primary industries (mostly mining and fisheries) accounted for 17 percent of total exports, light industries 70 percent and HCIs 13 percent. In 2008, their shares were 2 percent, 6 percent and 92 percent, respectively. The top 10 export items also changed dramatically .
Figure 3-2. Share in total employment by sector
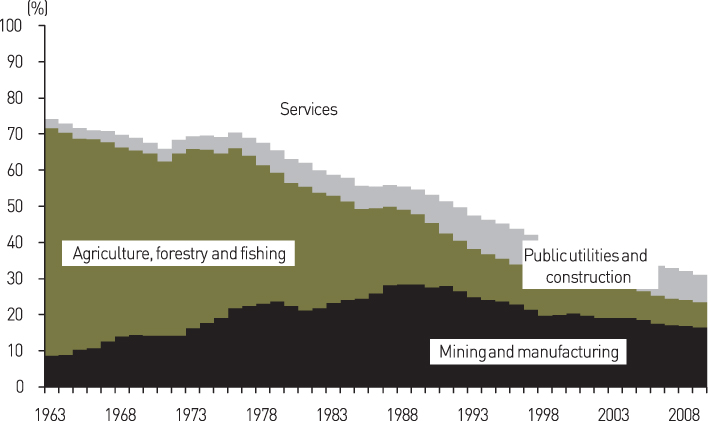
Figure 3-4. Share in exports by sector
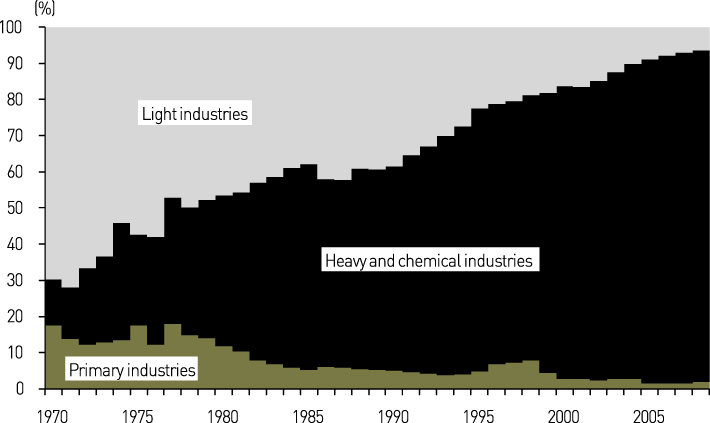
Table 3-3. Share of the top 10 export items in total exports
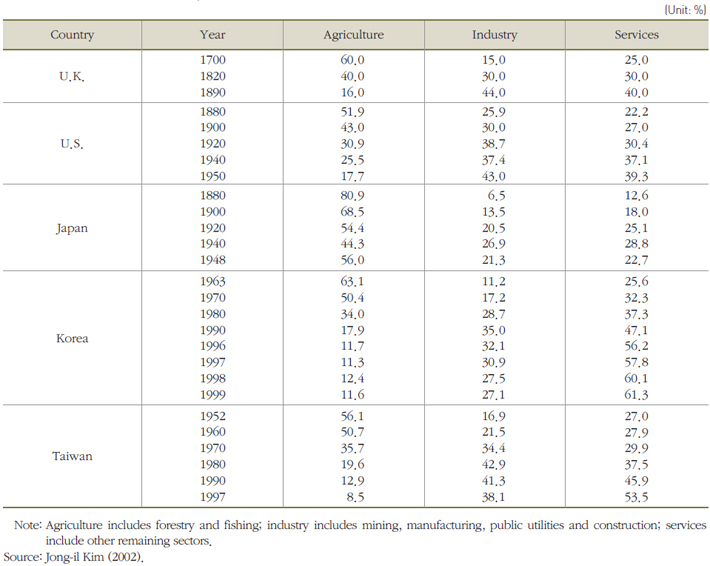
Similar patterns of structural change have been observed in other countries as well. According to Table 3-4, Korea’s industrial structure in the early 1960s was comparable to that of U.K. in 1700, the U.S. before 1880, and Japan in the early decades of the 20th century. These countries saw manufacturing and service industries replacing the agricultural sector in importance in the following decades. What sets Korea apart from these advanced countries is the speed with which it achieved its structural changes. Korea’s industrial structure in 1990 came close to that of U.K. in 1890, the U.S. in 1950, and Japan in 1970.
Table 3-4. Distribution of employment by sector
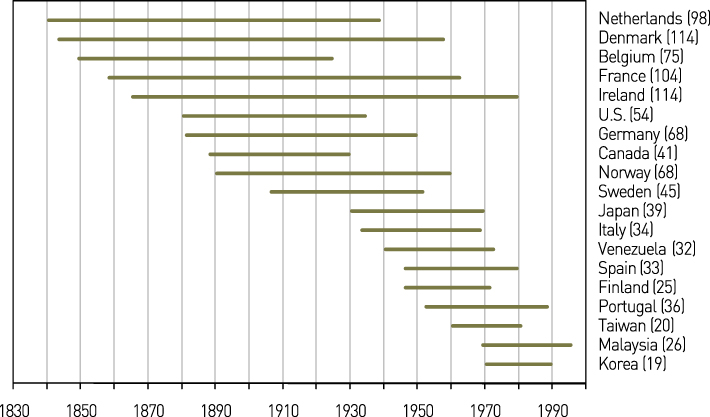
For an international comparison, Jungho Yoo (1997) defines“industrialization” as the process during which the employment share of agriculture fell from above 50 percent to below 20 percent. Figure 3-5 illustrates that industrialization took much longer for early starters than for the starters.
Figure 3-5. Periods of industrialization
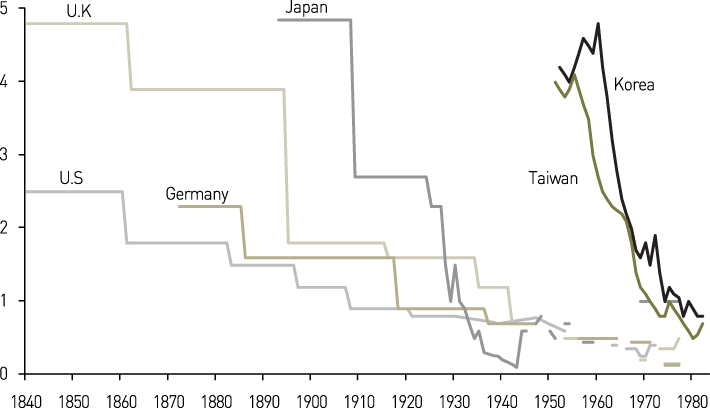
The transition from light industries to HCI-related ones within manufacturing is another common feature across economies. Figure 3-6 shows that the ratio of value-added of light industries to that of HCIs (Hoffman ratio) has been declining in advanced countries as well as in Korea. Again, the difference lies in the speed of decline. Korea indeed achieved “compressed” growth in the last few decades in much the same way as Taiwan and other East Asian countries did.
Figure 3-6. Trends of Hoffman ratio across countries
Source : SaKong, Il and Koh, Youngsun, 2010. The Korean Economy Six Decades of Growth and Development. Seoul: Korea Development Institute.
References
· Yoo, Jungho,“ The Impact of the Size of the Global Market on the Speed of Industrialization,”KDI Development Review, Vol. 19, No. 2, 1997, pp.73-157 (in Korean).